

In recent times, many readers have asked about overbought/oversold conditions in the coffee market. The idea that for every buyer there must be a seller and the two numbers should always balance has often been questioned. Let’s break down the concepts to better understand them and clear up any confusion.
What is Overbought and Oversold?
Table of Contents
“Overbought” or “oversold” refers to market conditions, not the quantity of transactions. It indicates whether a market is too heated (overbought) or oversold based on price movement, rather than the number of contracts. It’s not accurate to say “the number of lots bought/sold is too high.”
In simple terms, overbought refers to a market where the buying pressure has increased significantly, causing the price to rise beyond sustainable levels, while oversold refers to a market where there has been an excessive sell-off, resulting in low prices.
In a typical market, there are three types of participants:
-
Buyers who are purchasing.
-
Sellers who are offloading.
-
Those who are waiting to see the market’s direction.
At times, due to a surge in buying activity or a rumor, the buying side gains momentum, pulling in more participants. As prices increase, more buyers get attracted to the market, even if they were initially skeptical. However, at some point, the buying power may reach its limit, and that’s when the market hits an overbought condition. Conversely, oversold occurs when the selling pressure exhausts the market.
RSI – Relative Strength Index
To measure whether a market is overbought or oversold, technical analysts use the Relative Strength Index (RSI). Developed by Welles Wilder in 1978, RSI ranges from 0 to 100. The middle point of 50 is considered neutral. When the RSI is above 70, it signals overbought conditions, indicating the market may have risen too quickly. An RSI below 30 signals oversold conditions, suggesting that the market might have dropped too far.
How to Use RSI
Investors generally avoid entering the market when the RSI is in a neutral zone (around 50), as it doesn’t indicate a clear direction. They also steer clear of buying when the market is overbought (RSI > 70) and avoid selling when the market is oversold (RSI < 30).
RSI can be combined with trend lines and support or resistance levels to give further insight. For example, when RSI shows divergence from the price (i.e., the price makes a new high, but RSI doesn’t), it could signal a potential price reversal.
Divergence and RSI in Trading
Divergence occurs when the price and RSI move in opposite directions. For instance, if the price rises to a new high but RSI fails to follow, this could be a bearish divergence indicating a possible reversal. Conversely, if the price hits a new low but RSI stays strong, this could be a bullish signal.
As an example, if the price of coffee increases from $1,820 to $1,830, but RSI decreases from 65 to 60, it’s a sign of bearish divergence, signaling that the market might be nearing its peak.
RSI Calculation
The RSI is calculated using the average gain (U) and average loss (D) over a 14-period window, typically:
-
Calculate the average gain (U) for the last 14 periods.
-
Calculate the average loss (D) for the same 14 periods.
-
The RSI formula is then calculated as:
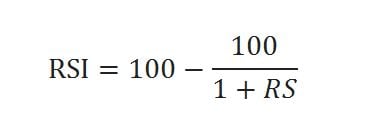
This gives us an RSI value, which we interpret according to the market’s conditions: above 70 for overbought and below 30 for oversold.
Practical Use of RSI
RSI isn’t a perfect tool, but it helps to gauge market sentiment. By monitoring RSI in conjunction with price movements, traders can make more informed decisions, avoiding buying into overbought markets or selling in oversold conditions.
While it won’t guarantee profits, using RSI can help minimize risks and make more calculated decisions, especially in volatile markets like coffee.